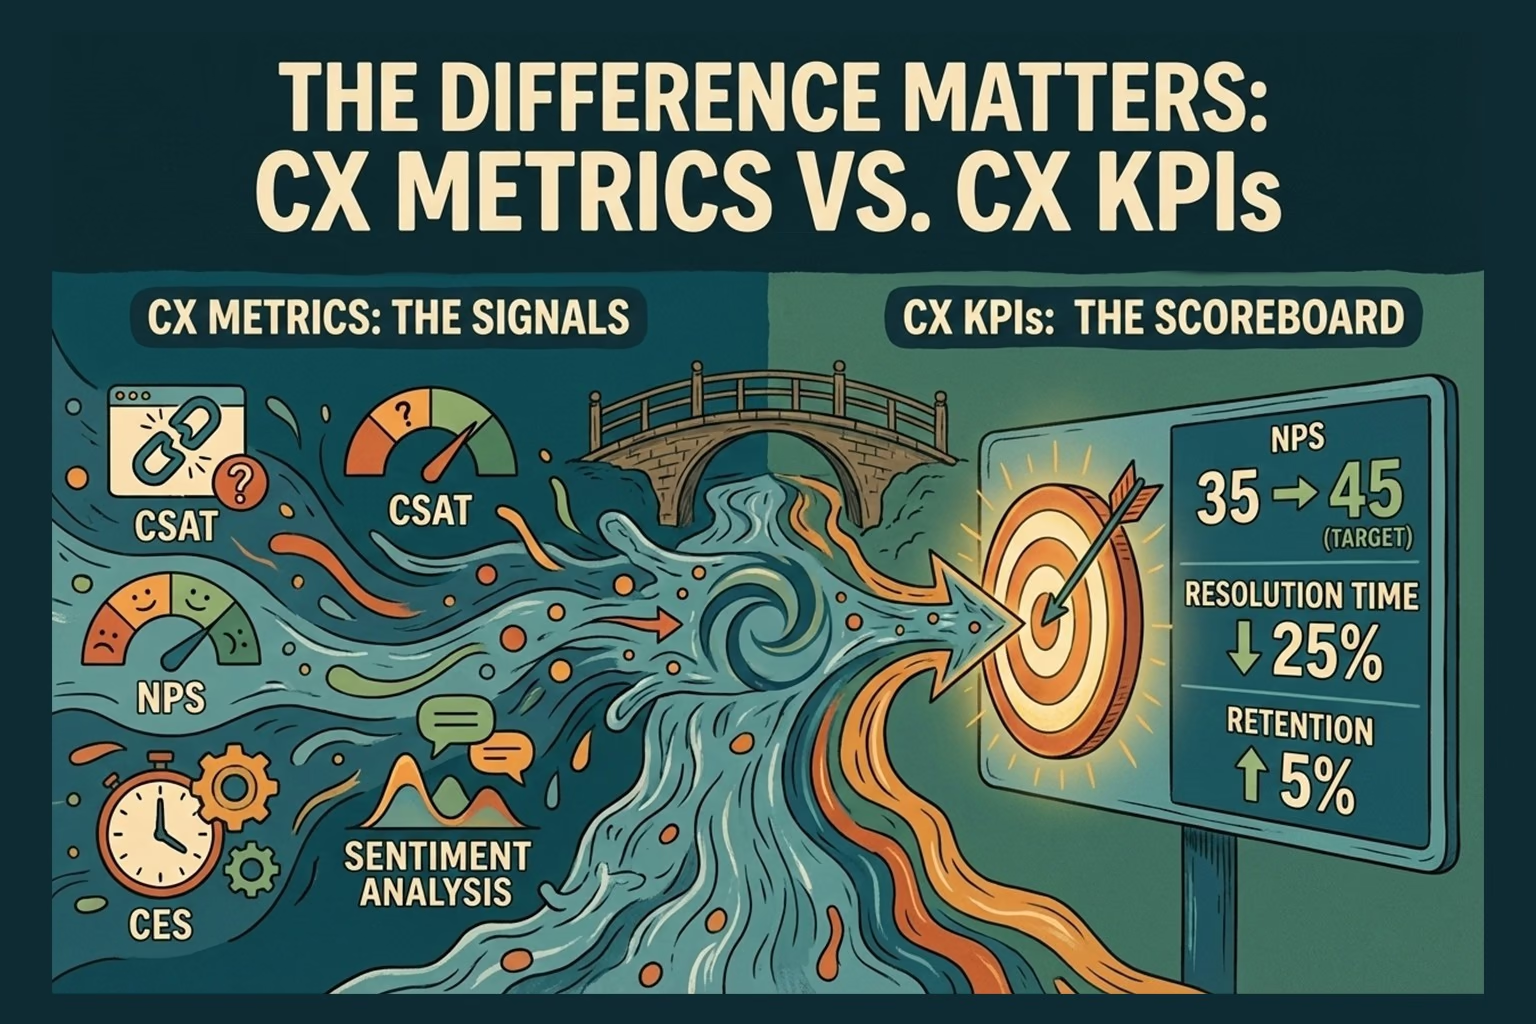
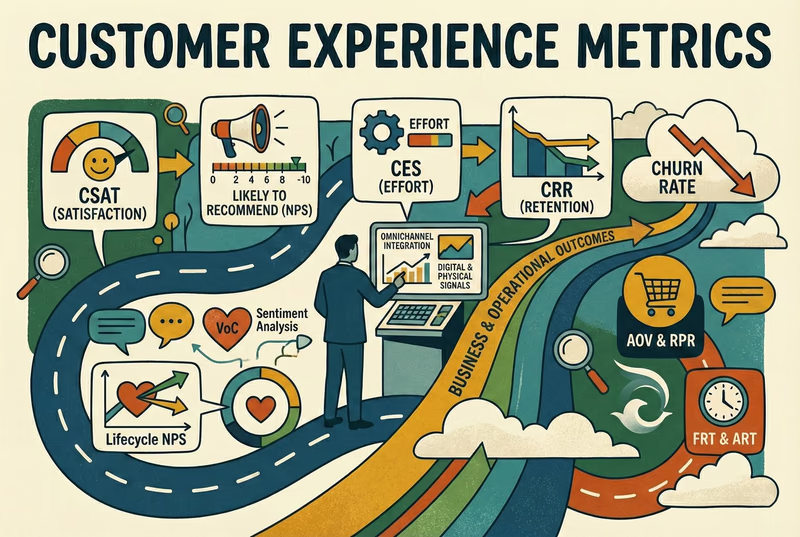
A CX metric is any number that describes what happened in your support, such as average response time or how many conversations you handled. A CX KPI is the small subset of those measures you have chosen to steer decisions, with a target attached because it links to a goal you care about. Put simply: every KPI is a metric, but most metrics are not KPIs.
This guide explains the difference for ecommerce and retail teams, then shows how to pick a few useful measures without drowning in dashboards or inventing benchmarks.
Metric versus KPI, clearly separated
The distinction sounds academic, but it changes how you spend your time.
- A metric is descriptive. It tells you what happened, for example "we replied in an average of four hours last week."
- A KPI (key performance indicator) is a chosen metric with a target and a reason, for example "keep first response under a set time because slow replies lose pre-purchase sales."
You will track many metrics. You should only elevate a handful to KPIs, because KPIs are what you actively manage against. If everything is a KPI, nothing is.
Why small teams should track fewer measures
Enterprise support teams can afford dozens of dashboards and someone to watch them. A small ecommerce or retail team cannot, and does not need to. Tracking too much leads to two problems: you spend time reporting instead of improving, and you lose the signal in the noise.
A lean team is usually better served by three to six measures they actually review, plus a slightly larger set of metrics they can look at when investigating a specific issue. Fewer, well-chosen measures beat a wall of numbers nobody acts on.
Operational measures
These describe how your support operation is running. They are the most actionable measures for a small team because you can usually influence them directly.
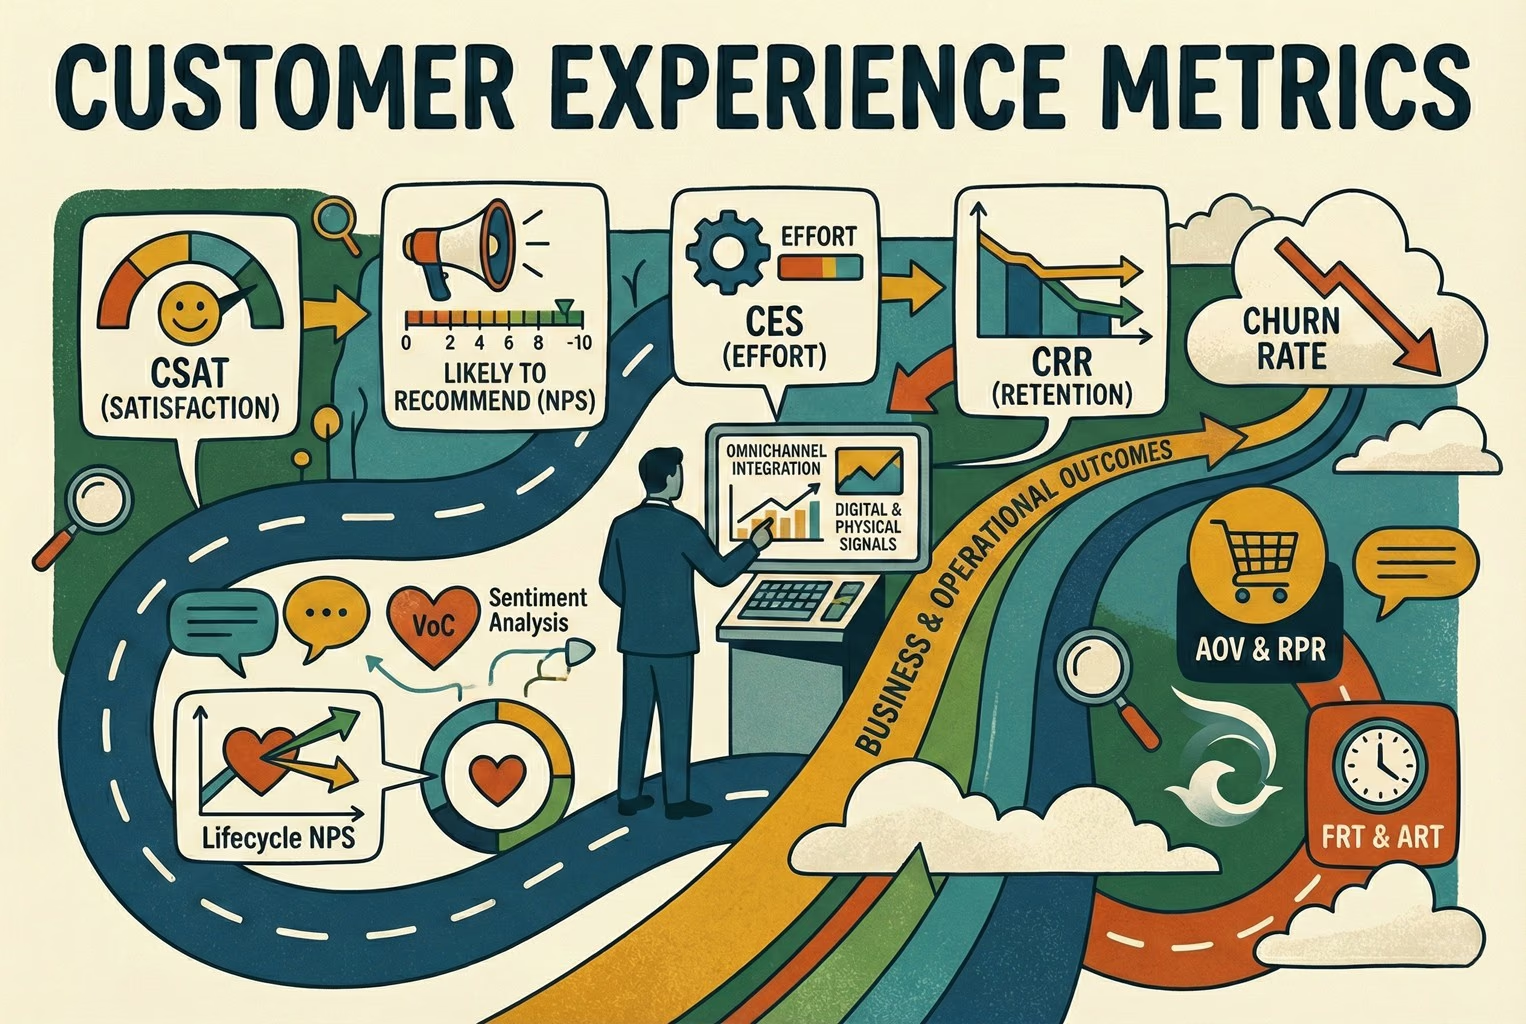
- First response time (FRT) - how long a customer waits for the first reply.
- Resolution time - how long until the issue is fully resolved.
- First contact resolution (FCR) - how often an issue is solved in one reply, without back-and-forth.
- Conversation volume - how many conversations you handle over a period.
- Reopen rate - how often a "resolved" conversation comes back.
- Escalation or handover rate - how often a conversation moves to a person or a more senior agent.
These are useful because they point to concrete fixes. A high reopen rate often means answers are incomplete. A slow FRT during certain hours might mean you need coverage or better self-serve content.
Customer feedback measures
These describe how customers felt, not just what happened operationally.
CSAT (customer satisfaction) is the most practical for small teams. It usually asks a customer to rate a resolved conversation. Treat it carefully: response rates are often low, and a handful of ratings can swing the number. Use it to spot patterns over time, not to judge a single week.
NPS (net promoter score) measures likelihood to recommend. It can be useful, but do not invent a target for it. There is no universal "good" NPS, and copying a benchmark you read somewhere will mislead you. If you use it, watch your own trend rather than chasing an external number.
Whatever feedback measure you use, read the comments alongside the score. For a small team, the written reasons are often more useful than the number itself.
Team and workflow measures
These describe how the work flows internally. They matter most as your team grows past one or two people.
- Backlog or open-conversation count, so nothing quietly piles up.
- Response consistency, for example whether common questions get the same approved answer.
- How evenly work is distributed when more than one person replies.
You do not need formal reporting for these early on. Even a weekly glance at the inbox can surface workflow problems before they affect customers.
Business outcomes versus support KPIs
It is important not to blur these two categories.
Support KPIs measure the support operation: response time, resolution, satisfaction. You control these fairly directly.
Business outcomes measure the business: repeat purchase rate, revenue, retention, lifetime value. Support influences these, but so do product, pricing, marketing, and many other factors. Do not claim a single support change "increased retention by X percent" unless you can genuinely isolate it, which small teams rarely can.
The honest approach is to manage your support KPIs, watch business outcomes for direction, and describe the relationship as influence rather than a guaranteed cause.
Example measurement groups for ecommerce and retail
To keep this concrete, here is one reasonable way a small store might group measures. These are examples, not required targets.
- Speed: first response time and resolution time.
- Quality: first contact resolution, reopen rate, and CSAT.
- Load: conversation volume and open backlog.
- Handover: escalation or human-handover rate.
From each group, promote one measure to a KPI once you understand your own baseline. The rest stay as supporting metrics you check when something looks off.
Choosing targets without inventing benchmarks
The safest way to set targets is to start from your own data, not from a number you read online. A simple approach:
- Measure your current baseline for a few weeks without changing anything.
- Set a modest, realistic improvement target from that baseline.
- Review whether the target is achievable and adjust rather than forcing it.
Avoid publishing or chasing industry "average" figures as if they were laws. Contexts differ enormously between a one-person store and a large brand, and a borrowed benchmark can push you toward the wrong priorities.
A simple review cadence
Cadence matters more than sophistication. A workable rhythm for a small team:
- Weekly: a quick look at speed and backlog to catch problems early.
- Monthly: review your chosen KPIs and one improvement to focus on.
- Quarterly: step back to check whether the measures you track are still the right ones.
A practical measurement table
| Measure |
Type |
What it tells you |
Review cadence |
| First response time |
Operational metric / candidate KPI |
How long customers wait for a first reply |
Weekly |
| Resolution time |
Operational metric |
How long until an issue is fully solved |
Weekly |
| First contact resolution |
Operational metric / candidate KPI |
How often you solve it in one reply |
Monthly |
| Reopen rate |
Quality metric |
Whether "resolved" answers actually hold |
Monthly |
| CSAT |
Feedback metric / candidate KPI |
How customers rate resolved conversations |
Monthly |
| Conversation volume |
Load metric |
How much support demand you handle |
Weekly |
| Handover rate |
Operational metric |
How often conversations move to a person |
Monthly |
A quick note on tooling: AskDolphin includes a dashboard with lightweight analytics, but it does not automatically report every measure listed here. Treat this table as a measurement plan, and check which numbers your tools can show versus which you track manually.
Conclusion and next step
For an ecommerce or retail team, good measurement is not about more dashboards. It is about separating metrics from KPIs, choosing a few measures you will actually review, and setting targets from your own baseline instead of borrowed benchmarks. Keep operational measures, feedback measures, and business outcomes clearly apart so you never overclaim what support alone caused.
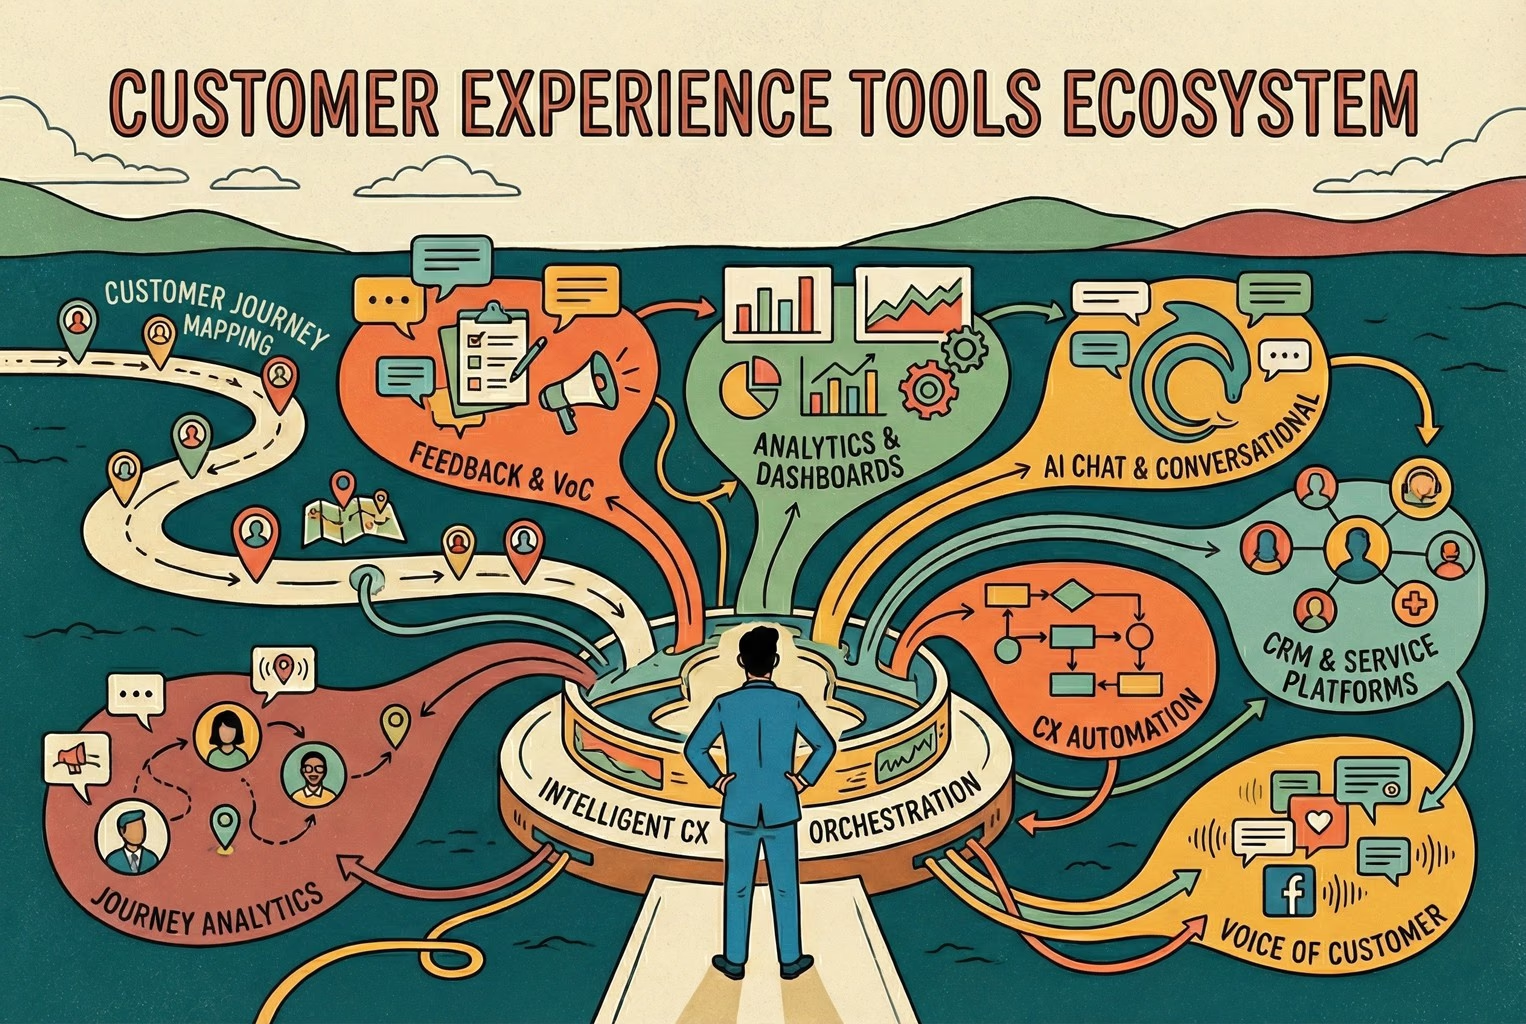
To connect measurement back to the bigger picture, see our overview of customer experience for retail teams and our practical guide to customer experience tools for retail teams. When you are ready to bring chat, email, and QR-code conversations into one workspace you can actually measure, you can create an AskDolphin account.